- Home /
- Explainable AI using Vision Transformers on Skin Disease Images
Explainable AI using Vision Transformers on Skin Disease Images
Shanel Gauthier, Data Scientist
Thursday, 15 September 2022
Over the past decade, we have witnessed tremendous breakthroughs in the field of deep learning. The medical field has benefited from all those advances where various Computer Aided Diagnosis (CAD) systems were offered to aid and facilitate the task of physicians.
Oro Health provides tools to healthcare professionals to create their virtual presence. Early on, Oro Health decided to develop AI solutions in the medical field. The foundations of Oro Health were laid by the birth of Dermago which allows patients to consult a dermatologist from the comfort of their home. Thus, we concentrated our effort on conducting robust experiments to classify skin disease images from real-world data.
After several conversations with dermatologists, it was clear that AI-explainability is a key component for physicians to trust deep learning models. But what exactly is AI-explainability? In frontiersin.org, they define it as: “a set of tools and frameworks that can help to comprehend and interpret Machine Learning (ML) predictions” [1].
For dermatologists, it can be hard to trust a tool they don’t understand. Thus, being able to explain why a decision is taken by a model is crucial. Therefore, we focus on this topic to improve the understanding of our AI solutions.
Explainability in Computer Vision
Convolutional Neural Network (CNN) is a widely used deep learning algorithm in Computer Vision (CV) that takes the spatial information of images into account. Various techniques have been developed to visualize image areas that contribute the most to CNN predictions. These techniques are used to visualize the decision process of deep models.
Most visualization techniques belong to one of these two classes: gradient methods and attribution methods [2]. Gradient-based methods rely on backpropagating through a CNN to compute the gradients with respect to the input of each layer. A lot of techniques in this category are implemented in the grad-cam PyTorch package. The second class of methods ‘attribution methods’ is based on the Deep Taylor Decomposition (DTD) framework.
Proposed Approach
In 2022, Vision Transformer (ViT) models are now widely used in a variety of computer vision tasks and are considered a competitive alternative to CNNs [3]. ViT consists of attention mechanisms (self-attention layers) that assign pairwise attention values between two image patches.
With the previously alluded techniques to generate relevancy maps, it is not clear how to apply these methods to the discrete image patches used in ViTs. Chefer et al. [2] propose, in their Transformer interpretability beyond attention visualization paper, a new way to visualize parts of an image that led to a classification using transformer-based models. Their approach yields state-of-the-art results compared to various methods and is based on assigning local relevance scores using the DTD principle and propagating the scores through all layers [2].
Applied Classification Task on Skin Disease Images: Our step-by-step tutorial
The proposed approach [2] is accompanied by a GitHub repository [4]. In the repository, the authors included a notebook to demonstrate how to create the visualizations.
In this section, we give a step-by-step tutorial on how we use their code to visualize parts of an image that led to a prediction using our skin disease classifier. Note that we use the PyTorch framework.
We utilize a ViT model, pretrained on ImageNet-1k. The ViT is the algorithm that yields the best performance for our task at hand so far. We fine-tune the model for our specific task which is to classify skin diseases on real-world images. In our experiment, we use the Timm [5] repository to fine-tune a pretrained ViT model.
The Timm package makes it very easy to fine-tune a pretrained model, which makes life easier for us.
Then, what we need to do is to save the state dictionary.
So now that we have fine-tuned a ViT model to classify skin disease images and saved its state dictionary, the next step consists of cloning the repository that contains the implementation to generate the desired visualizations [4].
For our task at hand, the model was fine-tuned to classify between 41 skin diseases. Our team has been working on this classifier for more than two years now. Originally, the number of classes was 15. Since then, we have had access to more images. The more classes are covered, the more useful the classifier will be.
The next step consists of creating a dictionary to map ordered numbers starting from 0 to their associated disease name.Before feeding the images to the neural network, we normalize them using the mean and standard deviation of ImageNet-1k.
In our previous experiments, we initially used the ViT model from the Timm package [5] and saved the state dictionary of the fine-tuned model. Again, we insisted on using the Timm package for fine-tuning our model because of its simplicity.
For generating the desired visualizations, we wanted to use the repository of Chefer et al. [2].
We create a list that contains the paths to the images for which we want to generate the visualizations.
Obviously, for confidential reasons, we are not allowed to show the images from our dataset. So we had to think about what images we could show in this blog. Then, I had an idea! In my family, we have a lot of skin diseases, including myself. So I asked my family members if I could use their images and feed them to the fine-tuned ViT to see which parts of the image contribute the most to the prediction. They all accepted and were very excited about it. For the first time in my life, I was happy to have a family with skin problems!
Among all the images my family sent me, I selected five of them. I made sure to include images that have a lot of background to see if the background contributes to the model’s decision. The dataset used to fine-tune the model contains skin disease images taken by the patients themselves. In some cases, we observe a lot of background information.
The selected images are shown below.
Skin Disease Images
Now it’s the moment we’ve been waiting for: the generation of relevancy maps.
Analysis of Relevancy Maps
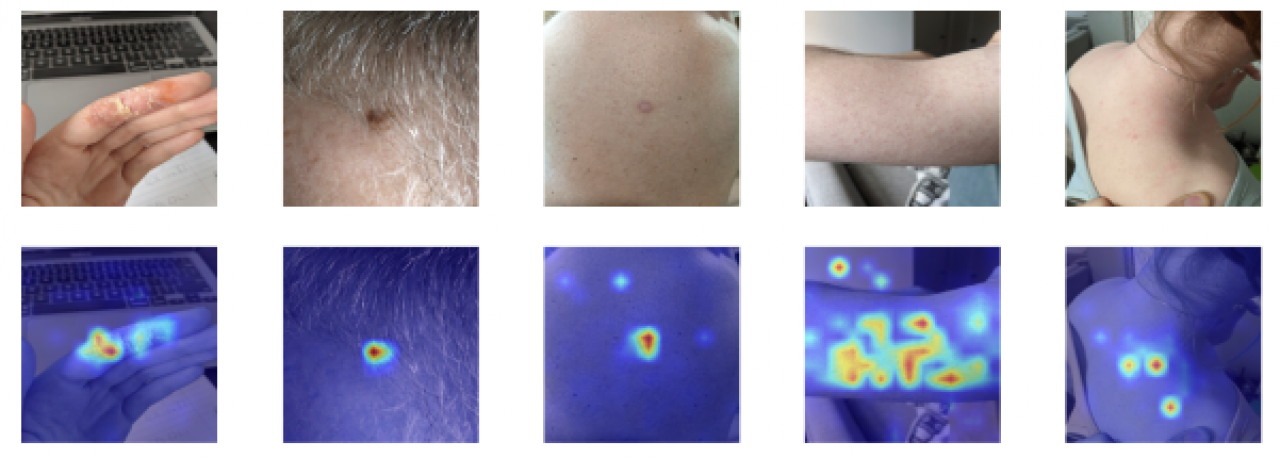
The generated maps are shown below. The first thing we wanted to verify is if the background contributes to the predictions. Only the affected skin area should contribute to the classification. We observe that this is the case for the five images.
In the first image, we observe a lot of background information. We can discern the keyboard of a laptop and a sheet of paper. However, only the affected finger has warm colours on the relevancy map. This confirms that the model is using the right information to make the decision.
Even though the skin lesion, in the second image, is partially covered with hair, the warm colours are only on this region. This is exactly what we want. Again, in the third image, the warm colours are only on the affected area.
In the fourth image, we observe much more regions with warm colours. The person suffers from keratosis pilaris, which is also known as the “chicken skin”. In the image, all the skin is affected. The warm colours are mostly on the skin, which is what we expected. However, there is a small circle of warm colours on the background, but it is negligible. The important thing is that most of the attention is on the skin, which is the case.
In the fifth image, the person has red patches near her right shoulder. We can discern some background information. Despite this, the warm colours are on the affected skin region.
Conclusion
In conclusion, we have presented a step-by-step tutorial on how we used the approach proposed by Chefer et al. to visualize parts of an image that contribute the most to a ViT prediction. We fine-tuned a ViT model to classify between 41 skin diseases. Then, we showed that even though there is a lot of background information in some images, only the affected skin region contributes to the model decision. These visualizations show dermatologists which part of the image the model uses to make a decision. It helps them trust a model and understand more about the AI solutions they are using.
References
[1] Explainable-AI and machine learning in Healthcare and wellness: Challenges, opportunities and future. Frontiers. (n.d.). Retrieved August 24, 2022, from https://www.frontiersin.org/research-topics/30823/explainable-ai-and-machine-learning-in-healthcare-and-wellness-challenges-opportunities-and-future#overview
[2] Chefer, H., Gur, S., & Wolf, L. (2021). Transformer interpretability beyond attention visualization. In Proceedings of the IEEE/CVF Conference on Computer Vision and Pattern Recognition (pp. 782–791).
[3] Boesch, G. (2022). Vision Transformers (ViT) in Image Recognition–2022 Guide.
[4] Hila-Chefer. (n.d.). Hila-chefer/transformer-explainability: [CVPR 2021] GitHub. https://github.com/hila-chefer/Transformer-Explainability
[5] Rwightman. (2022, July 24). Pytorch-image-models/vision_transformer.py. GitHub. https://github.com/rwightman/pytorch-image-models/blob/master/timm/models/vision_transformer.py